In a follow up to last month’s blog post regarding a recent study that was co-sponsored by the Coleman Institute for Cognitive Disabilities and the University of Illinois at Chicago’s Department of Disability and Human Development, this post is going to focus on the study as it relates to state trends.
The measure that the Coleman Institute set out to look at was every state’s fiscal effort. Fiscal effort is defined as a ratio for I/DD services per $1,000 of total statewide personal income. The chart below depicts a large variance between states, in fact there is a 600% variance between the top state, New York and the bottom state, Nevada. On average, the states spend $3.81 of every $1,000 on I/DD services.
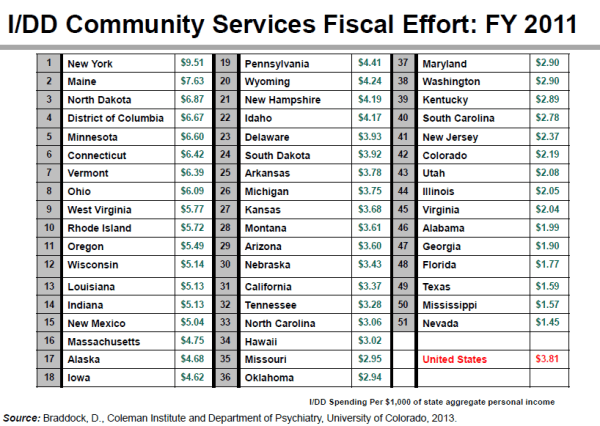
Where does your state fall in terms of ranking? The great thing about measuring states on fiscal effort is that it flattens out the pure size of a state budget for I/DD services and puts in terms of a ratio that effectively puts every state’s expenditures in a fair comparison to each other.
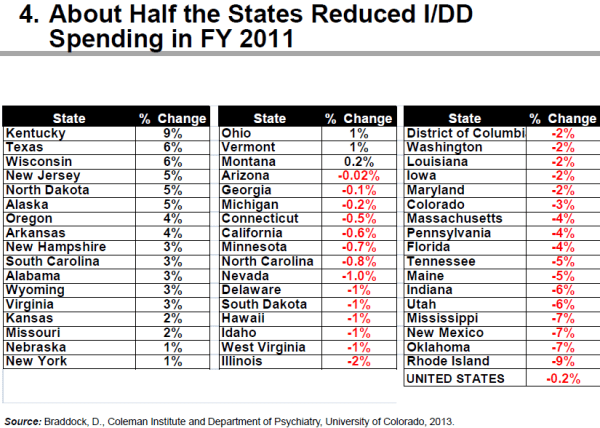
The next area of the study looked at current spending trends per state from the most recent year they could collect data, 2011. It seems as though every state is going through some fiscal challenges these days. State medicaid budgets undoubtedly represent a large portion of expenditures and as most of you know, become targets for reduction. In 2011, 30 states and Washington DC saw reduced spending at the state level on I/DD services. On average for all states, spending shrunk by .2%. How does your state rank here?
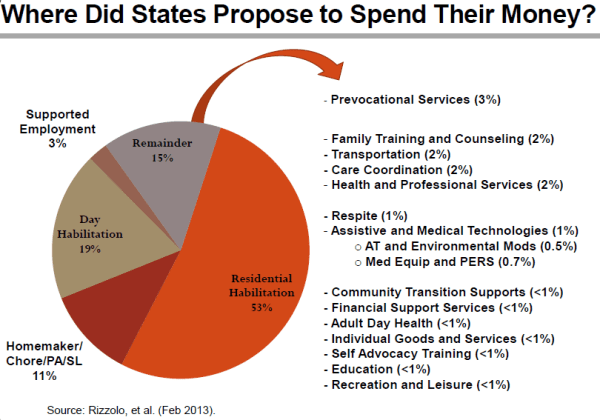
The next area of the study gets into a trend in services that states are starting to implement. When it comes to cutting funding for I/DD services, what makes up the most cost? It’s residential services. So states are starting to implement “Supports Waivers” as an alternative to more traditional waivers. What’s the difference? Supports waivers cover all of the services of traditional waivers except residential services. As noted in my March blog post on this topic, only 13% of individuals receiving services from state money nationwide utilize residential services. Most live with family or friends. The Supports Waiver relies on what are called “unpaid natural supports” aka family or friends to provide residential services at no cost. The result is a dramatic decrease in the average annual cost per individual. This trend is most likely to continue so if a Supports Waiver is not currently implemented in your state, be on the look out. For providers that provide a great deal of residential services this is an alarming trend.
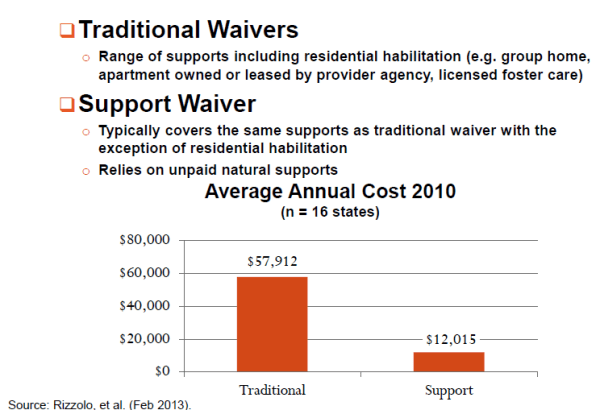
These statistics illustrate that there are great disparities from state to state on spend as well as waivers. It’s important to see what’s going on in our nation as a whole to get a better understanding of where your state fits in and what to expect going forward. Flexibility of services and doing more with less are two good ideals to adopt at your agency going forward. These trends indicate that this is the path we will continue go in the coming years.
For more information on this study, please visit


